New to Commons: Intuitive Tools to Understand and Lower Your Carbon Footprint
Join the community


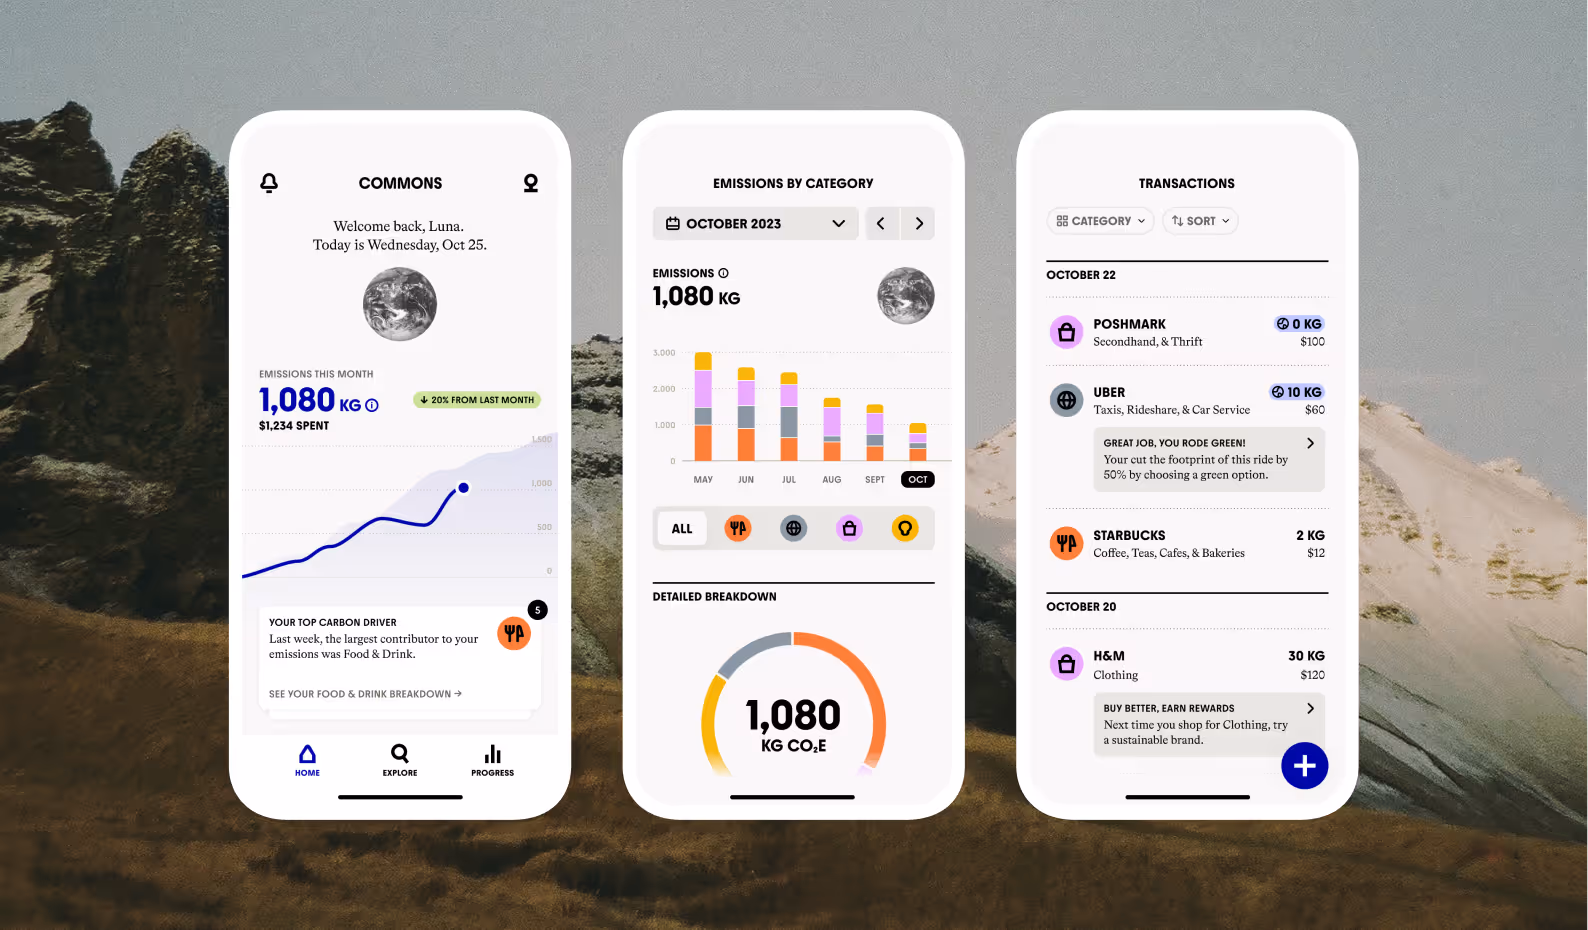
Today, we launched major updates to the Progress tab that make it easier and more intuitive to understand precisely where your emissions are coming from, where you’re making progress, and how to lower your emissions over time. We’ve added new graphs to see your crucial sustainability metrics at a glance and more robust filters so you can dive deeper into every bit of data.
Let’s take a look at the new tools and features.
.gif)
Understand your progress: Compare emissions by month or year
We’ve added new filters to the top of the Progress page so you can toggle between month and year to see how your emissions have changed over time. You’ll see these options across all Progress screens.
Explore the Progress page
- Which month were your emissions the highest? Which month were they the lowest?
- Switch to the yearly view from the dropdown up top, then scroll to the Emissions by Category block. What were was highest emissions category this year?
- Switch to the yearly view from the dropdown up top, then scroll down to the How You Compare block to see how your annual emissions stack up.

Analyze your footprint: Discover where your emissions come from
With the new “Emissions by Category” card on the Progress page, it’s easier than ever to understand the sources of your emissions. Tap on the card to see the breakdown of your emissions by month or year. Tap through the categories to each emissions type isolated on the graph.
Scroll down the Emissions By Category page to the Detailed Breakdown section, then tap into a category to see which transactions are contributing to those emissions.
Explore the Emissions by Category page
From the Progress tab, tap into Emissions By Category to find out:
- Which category is consistently your highest carbon driver?
- Which month did you have the highest travel emissions?
- What were the largest-emissions transactions contributed to your biggest category last year? To find this out, switch to the yearly view and scroll to the Detailed Breakdown on the Emissions by Category page. Then tap into the top category. There, you’ll see a breakdown of your emissions by transaction.

Recognize sustainable spending: Track your climate-friendly purchases
The Sustainable Spending section will show you what percentage of your purchases are climate-friendly. There are thousands of purchases that are climate-friendly including purchases from places like thrift stores or farmer markets, or purchases on EV charging or public transit.
Your sustainable spending percentage is how your rewards are calculated, so keep an eye on this throughout the month. You can also see how you compare to the average Commons user.
See our full list of climate-friendly brand criteria.
Explore the Sustainable Spending page
From the Progress tab, tap into Sustainable Spending to find out:
- What percentage of your transactions were climate-friendly last year?
- Tap through the months to see how your rate of sustainable spending has changed over time.

Contextualize your impact: See how you compare
Emissions can be a hard metric to grasp. Of course, you want to lower your emissions over time, but how do you know exactly how well you’re doing?
With the new comparison section, you can see how your annual emissions compare to the average American and the average Commons user. Tap in to also see how you compare to the global and UK averages.
Explore the How You Compare page
From the Progress tab, tap into How You Compare to find out:
- How often your monthly emissions are below the Commons average
- How your annual emissions compare to folks in the UK
Stay on track: Personalized tips for everyday, sustainable spending
You’ll find your transactions view when you tap the credit card icon in the top right of the progress page.
New to the transactions page, you’ll see the ability to toggle Purchase Insights off and on. With Purchase Insights, you’ll see sustainable spending recommendations on various purchases.
Explore the Transactions page
From the Progress tab, tap the card icon in the top right to find out:
- Which transactions have recommendations for more climate-friendly brands?
- Sort by Emissions to discover your highest-emission purchases
- Filter by category to find out your highest-emissions food purchase

.png)
.png)